A complete physical model for Gigabit Ethernet optical communication systems

By Asghar Gholami, Denis Molin, Pieter Matthijsse, Gerard Kuyt, and Pierre Sillard
OVERVIEW
Draka has developed a complete physical model for 10GbE communication systems using 850-nm VCSELs and MMFs. The model has shown that pure EMBc optimization is not enough for total 10GbE system optimization.
High-speed optoelectronic modules using vertical-cavity surface-emitting lasers (VCSELs) coupled to multimode fibers (MMFs) offer efficiency and low cost for short Gigabit Ethernet (GbE) optical links. VCSELs and MMFs optimized for 10GbE transmission over 300 m at 850 nm have been standardized, but now there is a trend to extend the MMF specifications for increased bit rates and/or link distances. This development requires new modeling activities.
Two standardized models are commonly used today. The IEEE system link model gives the effective model bandwidth (EMB) required for 10GbE transmission based on penalty computations; the TIA/IEC MMF model computes the EMB for various VCSEL launching conditions and fiber differential mode delay (DMD) patterns. Thus, EMB specification can translate into DMD specifications. Chromatic dispersion is included in the link model but not the TIA/IEC MMF model.
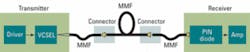
Draka has developed a complete physical model of an MMF-based transmission system from the transmitted bit pattern to the received eye diagram and associated BER values (see Fig. 1). It includes a dynamic model of multimode VCSELs and the simultaneous effect of the modal and chromatic dispersions during propagation. DMD measurements are also modeled according to IEC 60793-1-49 and FOTP 220, as well as other relevant parameters present in the IEEE 802.3 standards.
The model consists of:
- a spatiotemporal transversally multimode VCSEL model that computes the directly-modulated optical signals carried by each transverse mode. The transverse modes of the VCSEL and their wavelengths are determined using VCSEL parameters. It models the modes' competition, the relative intensity noise (RIN), and the effect of temperature on VCSEL behavior.
- a fiber model that solves the scalar- wave equation for computing the guided modes of the MMF and their propagation characteristics. This fiber model also simulates the DMD measurements for computing DMD values and the calculated EMB (EMBc).
- a system model that calculates, for instance, the coupling between the source and the launch patch cord, and the coupling between the patch cord and the MMF used for the transmission.
The coupling model computes the field at the MMF input and the mode power distribution (MPD) in the MMF, considering lateral and angular offsets at the connection. The propagation in the MMF is computed using the MMF transfer function that considers the power, group velocity, and chromatic dispersion of each MMF guided mode, as well as the different connectors. The receiver is also modeled, based on a PIN photodiode and on amplifiers with quantum, dark, and amplifier noises. Finally, the bit-error rate (BER) is calculated, taking into account intersymbol interference (ISI), transmitter and receiver noises, and jitters in all the bits of the signal.
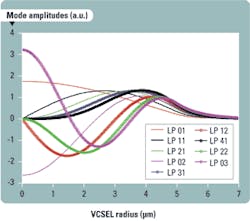
The VCSEL is a key part of the system -- transversally multimode and longitudinally singlemode. This model computes the mode fields and their wavelengths under the weakly guiding approximation using cylindrical VCSEL cavity structure parameters.
Figure 2 shows mode profiles of a VCSEL with a diameter of 6 µm and an index contrast between core and cladding of Δn=0.01.
A multimode VCSEL emits several transverse modes. Depending on the applied current and due to the spatial hole burning (SHB) phenomenon, there is a competition between the modes. The spectrum of such sources is discrete and wide because each transverse mode exhibits its own wavelength
.
To calculate the time domain behavior, the rate equations were solved in carrier and photon number, taking care of the carrier, photon, and current densities in the VCSEL active region and the noise caused by the spontaneous emission, which is the source of RIN. Several parameters are incorporated, including the stimulated emission gain, photon lifetime, electron lifetime, gain saturation factor, and spontaneous emission coupling coefficient.
The VCSEL spatial multimode operation is also considered, and a set of spatially independent differential equations provides an explicit description of the spatial model dependence. This provides a good tradeoff between accuracy and computational speed. These multimode VCSEL rate equations are completed by including specific temperature dependence and photon noise sources.
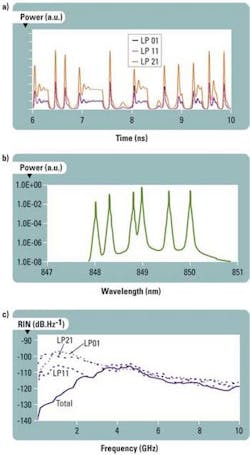
For example, Fig. 3a shows the VCSEL dynamic response to a square input current. The output is shown for three modes of the VCSEL from Fig. 2 at 850 nm. The output signal exhibits relaxation oscillations and competition between modes that could generate transmission errors -- critical for BER modeling. The power distribution over all VCSEL modes depends on the VCSEL parameters, applied current, bit rate, and binary sequence.
Transversally multimode VCSELs may exhibit a wide linewidth, due to their multimode nature, that must be kept below 0.45 nm RMS, according to IEEE 802.3ae. Thus, the optical signal generated by such a source will likely be sensitive to chromatic dispersion. Figure 3b shows the calculated spectrum of a VCSEL.
The RIN, an important noise source from the VCSEL model, is specified to be less than -128 dB/Hz. This noise is responsible for the noise floor that may be observed in BER versus received power curves. Figure 3c shows the calculated RIN spectrum of the VCSEL. The peaks at lower frequencies result from competition among the different modes. The power fluctuations in each transverse mode are a hundred times larger (20 dB) than those of the total power for frequencies up to the relaxation frequency. This shows an interaction and a correlation between the RIN of the different modes. Due to this correlation, any mode filtering or phase shifting at the coupling into the MMF or during propagation will increase the noise intensity, thus deteriorating transmission quality.
The fiber model solves the scalar-wave equation and computes all the guided modes and their propagation characteristics for arbitrary refractive-index profiles. The refractive indexes are computed from the multimode fiber core dopant contents to account for the material dispersion contribution to the chromatic dispersion, according to the well-known Sellmeier coefficients.
Based on the mode field computations, DMD measurements are simulated to study the system performances as a function of conventional fiber parameters, such as DMD values and EMBc. Modeling the DMD plots from the dopant contents allows simulation of many refractive-index defects and the use of measured refractive-index profiles -- guaranteeing realistic DMD plots.
VCSEL-to-MMF coupling is critical for defining the launching condition, thus affecting the bandwidth. The model assumes there is no lens between the VCSEL and the launch patch cord and takes into account the gap and offset between the two components because, in practice, the VCSEL and the MMF may not be perfectly centered.
The MPD induced in the MMF depends on the VCSEL, the lateral and angular offsets with the VCSEL output, and the VCSEL and MMF modes. The incident field is expanded into the orthogonal basis of the full set of MMF guided modes. This expansion is done through computations of the overlap integrals between the incident field and each MMF guided-mode field.
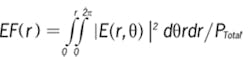
The encircled flux (EF) from the MPD, used in practice and standards to quantify the launching condition, is computed. EF(r) with the following equation, is the power portion that is encircled with a radius of r from the center of the fiber. IEEE 802.3ae defines the EF at the source patch cord to be EF(4.5 µm) <30% and EF(19 µm) >86%
.
In the modeled system, there are two MMF-to-MMF connections. At these connections, each mode of the first fiber excites the modes of the second. The MPD in the second fiber depends on the MPD in the first, the offsets between the two fibers, and the refractive-index profiles of each.
The link transfer function from the VCSEL to the input of the receiver is calculated considering chromatic and modal dispersions of the MMF used for transmission. Due to short lengths, transmission in the source and receiver patch cords is neglected. The transfer function of the VCSEL modes is computed at their corresponding wavelength.
The receiver consists of a PIN photodiode and a transimpedance amplifier, followed by a limiting amplifier for signal reshaping. The voltage signal is calculated considering the quantum and dark noises of the PIN photodiode and the thermal noise due to detector electronics. The receiver model calculates the parameters defined in the IEEE-802.3ae standard for the receiver specifications. This helps to study MMFs with receivers that satisfy the 10GbE standards.
To quantify the influence of the different parameters (MMFs, couplings, and modulation speeds), a method was developed to estimate the BER from the simulated eye diagrams. This is difficult due to the complex form of the response including noise, random and deterministic jitters, ISI, and VCSEL relaxation oscillations -- giving overshoots and undershoots. These effects are rarely taken into account.
Generally, only the Q factor is considered for the BER estimation. Our BER calculation extends to all the bits of a selected pseudo-random bit sequence (PRBS). For a selected decision level and sampling instance, the Gaussian distributions are fitted for each of the bits and the BER is estimated. The average is used to compute the total BER.
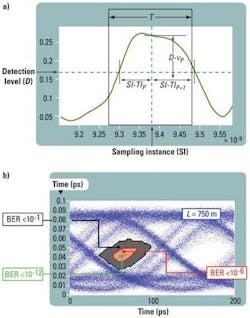
In Fig. 4a, BERQp gives the BER of the p bit due to the Qp factor where σp and Bp are the mean and standard deviations in the sampling instance; and BERJp gives the BER of the p bit caused by the jitter. TIp is the signal transition time from decision level, and RJp is the random jitter. For the bits without a state transition BERJp = 0. Figure 4b shows BER margins drowned by estimations of BERs in different decision levels and sampling instances.
For model validation, BER calculations are compared with BER measurements on different MMFs. Studying the BER dependence on received power is typical for evaluating the performance of an optical transmission. An optical attenuator precedes the receiver to adjust the received power.
As an example, BER calculations are compared with the experimental results obtained with two different 750-m MMFs and fixed sources/receivers. The spectral width of the source is measured at 0.33 nm RMS. The source and receiver parameters are adjusted to match those used in the experiments. Non-available parameters are considered to be at their nominal values to stay within the IEEE 802.3 standard ranges. The most important receiver parameter is noise. The noise value in the receiver model was adjusted to fit the calculated and measured BER curves of a 2-m fiber (back-to-back condition). For each MMF, the refractive-index profile was tuned to get similar DMD plots and EMBc values.
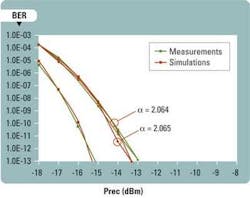
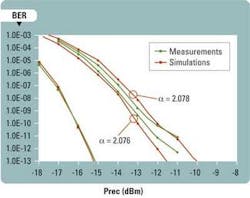
Figure 5 compares experimental BER curves for an MMF with EMBc = 7.5 GHz.km and calculated BER curves for a MMF with EMBc = 7.2 GHz.km and similar DMD plots. Figure 6 compares experimental BER curves for an MMF with EMBc = 10.4 GHz.km and calculated BER results for an MMF with EMBc = 9.4 GHz.km and similar DMD plots. Both figures agree with calculated and experimental BER results.
The validated model shows the effect of the VCSEL spectral width on the quality of a 10GbE transmission. Figure 7 shows the power penalty as a function of fiber length for a fixed BER = 10-12. Increasing the fiber length degrades signal quality. As a result, the power must be increased to detect the signal.
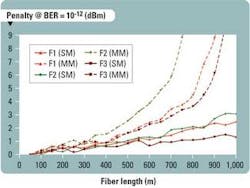
In Fig. 7, power penalties for a singlemode VCSEL of 0.01-nm RMS linewidth are compared with those of a multimode VCSEL of 0.5-nm RMS linewidth for three different MMFs. Both VCSELs are adjusted to excite the same MPD in the fibers. EMBs of the MMFs for the singlemode source are EMBF1= 4.4 GHz.km, EMBF2 = 3.57 GHz.km, and EMBF3 = 5.98 GHz.km.
The penalties strongly increase with fiber length for the multimode VCSEL, whereas the singlemode VCSEL is less sensitive. This difference clearly illustrates the influence of chromatic dispersion that cannot be neglected in multimode VCSELs for fiber lengths longer than 400 m. This leads to a power penalty difference of 2 dB for the 550-m Fiber 2.
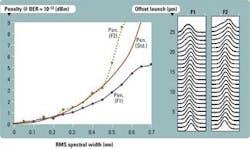
Figure 8 shows the calculated power penalties caused only by the chromatic dispersion as a function of the source spectral width for two 750-m-long MMFs, F1 and F2, and compares them with the penalty calculated with the IEEE link model used in the 10GbE standards. The MMFs have different forms of DMDs (see DMD plots on Fig. 8) but the same EMBc of 6 GHz.km.
The power penalty caused by the chromatic dispersion depends on the modal dispersion, shown in Fig. 8. For F1, the penalty increases slowly and is lower than the penalty calculated by the IEEE link model. For F2, the penalty strongly increases with the source spectral width and, for high values, is much greater than the value calculated with the IEEE link model. This illustrates that chromatic dispersion and modal dispersion are not independent and that a high EMBc doesn't necessarily result in the best system behavior.
Draka has developed a complete physical model for 10GbE communication systems using 850-nm VCSELs and MMFs. The model shows that chromatic dispersion of fibers longer than 400 m is not negligible and cannot be considered independently of the modal dispersion. This leads to the conclusion that pure EMBc optimization is not enough for total 10GbE system optimization. Only high-quality fiber processes and high-precision DMD measurements can guarantee excellent BER performance.
Asghar Gholami, Denis Molin, Pieter Matthijsse, Gerard Kuyt, and Pierre Sillard hold various positions within the Fiber Product Technology and Telecommunication Modeling Group of Draka Communication (www.draka.com), headquartered in Amsterdam, the Netherlands.
1. A. Gholami, D. Molin, P. Matthijsse, G. Kuyt, P. Sillard, “A Complete Physical Model for Gigabit Ethernet Optical Communication Systems,” IWCS 2008, paper 10-1.
LINKS TO MORE INFORMATION
Lightwave:Certifying MMF for 100G Ethernet Transmission
Lightwave:Take Control of Your Link-Loss Budget