GPON vs. EPON: A cost comparison
A new standard, the ITU-T GPON recommendation, recently has emerged to give service providers a third PON option. Regardless of the relative technology merits of the architectures under consideration, the lowest-cost approach often finds the most favor among carriers. With that in mind, here is a simple cost comparison between EPON and GPON for a given FTTP network.
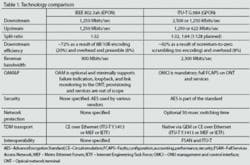
A key factor in determining the cost of an FTTP network is to understand the performance characteristics of the PON technology. Critical cost-bearing factors include PON bandwidth, bandwidth efficiency, and split ratio. Table 1 highlights the performance and operational differences between EPON and GPON technology.
From Table 1, GPON seems better suited for implementation in carrier networks since it provides the necessary support for operation and maintenance, interoperability, and security, all necessary for large network operation.
But as mentioned, these technical merits alone will not result in an industry endorsement for GPON. For the access network, cost is the final determining factor. Thus, the results of a fair cost comparison with EPON will determine the viability of GPON technology.
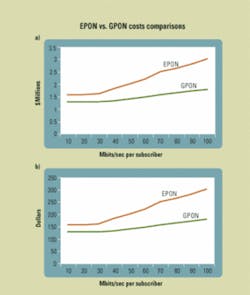
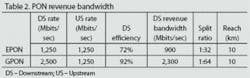
For a simple cost comparison between EPON and GPON, only the total equipment costs for an FTTP network of 10,000 subscribers with a 100% take rate of service will be considered. To keep the analysis uncomplicated, only sustained-rate Ethernet-based services will be considered, since that is the type of service for multiple IPTV and high-definition TV streams into the home. Also, the outside plant will be treated as equal, although the PON split ratio will be different. For a comparison based on the merits of each technology, we’ll also assume that the cost of EPON and GPON optical line terminals (OLTs) are the same ($1,800 per interface) as well as the respective optical-network terminals (ONTs) ($100 per subscriber).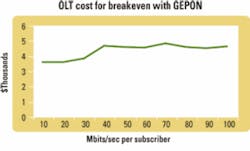
Since the total cost savings of an FTTP network using GPON is due to the savings in the number of OLTs, the OLT cost sensitivity becomes a factor. The GPON OLT breakeven cost sensitivity can be determined by applying the difference between an EPON and GPON deployment cost to the total number of GPON OLTs with fixed-cost ONTs. The GPON to EPON cost breakeven sensitivity for the GPON OLT is shown in Figure 2.
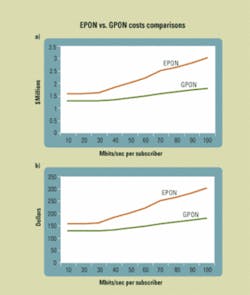
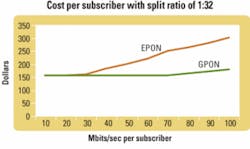
A major factor for GPON’s cost performance is its split ratio. Thus, the cost per subscriber impact in reducing the GPON split ratio to 1:32 needs to be determined. Figure 3 shows the results.
This simple cost analysis for a given FTTP network highlight’s GPON’s significant cost advantage over EPON. That is due to GPON’s higher split ratio, line rate, and bandwidth efficiency, which results in a reduction in the amount of OLT equipment by more than a factor of 2 over EPON. That also translates into significant space and power reduction at the central office as illustrated in Table 3 as well as lifecycle cost savings due to the reduction in OLT equipment.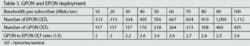
As with ITU-T G.983 BPON, GPON also promises equipment interoperability through Full Services Access Network (FSAN) and ITU initiatives. That enables ubiquitous deployment of PON, whereby various vendors’ OLTs and ONTs can be mixed and matched across a network as is done with BPON. It also enables the supply of low-cost high-volume PON ONTs from customer premises equipment vendors as is done in the DSL industry, thus further enabling low-cost PON deployment.
The currently acceptable price of EPON from vendors has enabled service providers to deploy residential PONs en masse in Asia. The ITU-T G.984 GPON standard provides native carrier class transport of both Ethernet and legacy TDM and thus has the promise of a single cost-effective PON technology for both residential and business service.
As consumer bandwidth increases from 10 Mbits/sec for best-effort high-speed Internet data up to sustained 100 Mbits/sec for multiple IPTV streams of standard- and high-definition television, GPON offers a significant cost advantage over EPON.References
1. G. Kramer, Teknovus, “How Efficient is EPON?”
2. ITU-T Recommendation G.984, “Gigabit-capable Passive Optical Network (GPON).”