All-band testing enables component optimization
The most recent advances in the telecommunications industry have mainly targeted metro and access networks to serve bandwidth-hungry applications such as SANs, video on demand, high-definition TV, smart houses, and teleconferencing. New fibers have become available that enable transportation of any wavelength along the O-, E-, S-, C-, L-, and U-bands, and network service providers are planning major investments in the next five years.
Components associated with these new applications are diverse, and an adequate methodology to test them, in most cases has not been truly implemented. With component production levels on the rise, new approaches must be considered. The capacity to test components on all the bands in one test station offers much promise since all-band testing allows network service providers to optimize and futureproof both PON and CWDM networks.
There are two main types of passive components in a PON. First, there’s the WDM coupler (used in triplexers, for example), whose principal function is to split or combine the different wavelengths used in a PON system (1310, 1490, and 1550 nm). Second, there is the 1×N or 2×N splitter, where N can typically represent four, eight, 16, or 32 channels.
Since these components are used at different locations in the PON, their testing requirements differ. For instance, WDM filters need to provide an adequate isolation between bands, while 1×N or 2×N splitters are expected to be as uniform as possible. Although the requirements of these devices will vary, the necessity to understand their spectral responses will always remain. The ITU 983 (BPON) standard states that these optical devices need to be characterized over at least two spectral ranges (i.e., the 1260-1360-nm range at the optical-network terminal and the 1480-1580-nm range at the optical line terminal).
One of the more important responses refers to power. It is generally known that a 1-dB loss in the power budget of a PON has a major impact on its reach and the revenue it can generate. For instance, an extra 1-dB loss at 1310 nm, where attenuation is in the range of 0.35 dB/km, translates into a reduction of the network’s reach of at least 2.8 km. In some situations, that can significantly affect potential installed-base revenue. Accurately estimating the expected performance of the PON components may therefore become critical.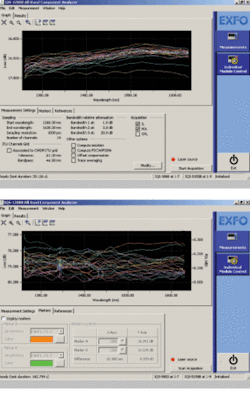
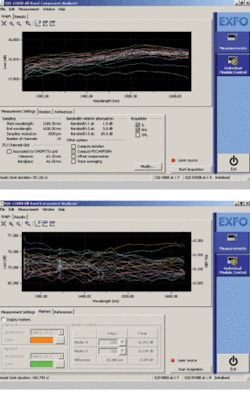
Figures 1a and 1b, respectively,illustratean example of the insertion loss (IL) and polarization-dependent loss (PDL) of all the output ports of a 1×32 splitter, where we can clearly see that the uniformity criteria are reached on all channels. While most component manufacturers have established ways to measure IL over a wide wavelength range, that doesn’t seem to be the case for PDL, which is generally tested only at a few wavelengths. Therefore, PDL variation is easily underestimated in all PON bands of operation.
Until now, CWDM network deployments have been mainly associated with SANs and metro applications and can be seen as a “low-cost DWDM” option. While there have been many discussions over whether CWDM components are actually cheaper to produce, the wavelength grid defined by the standards covers configurations up to only 16 channels, limiting the number of possible configurations and restricting the diversification of the inventories, which in turn can regulate maintenance costs.
The most common of these configurations are the four- and eight-channel devices, which need to be tested over 100-160 nm in the 1460-1620-nm range (i.e., the S-, C-, and L-bands, depending on the exact configuration). The 16-channel configuration exists to a much lesser extent and must be tested in the 1260-1620-nm range. With the need to guarantee at least 45-55-dB isolation between channels, it may not be easy to find the ideal test approach that combines wide wavelength range, wide dynamic range, and of course wavelength and loss accuracy. Although it is true that wavelength precision requirements for PON and CWDM applications are more lenient than they are for DWDM testing (50-pm or even 100-pm sampling resolution is considered acceptable, compared with 5 pm for DWDM), the requirements for loss accuracy remain just as stringent.
The fact that we expect to see hybrid approaches in the near future that integrate CWDM or DWDM components into PONs to increase the bandwidth in the access only adds to the necessity to accurately characterize components over all bands. Typically, most passive components are tested using one or a combination of the three methods that follow.
Discrete wavelength testing. The most basic test system comprises one or more lasers and a combination of power meter, optical return loss (ORL) meter, and polarization scrambler. The use of switches to toggle between the different sources and meters can add some level of automation and improve the overall test time of the combined setup. However, this approach provides very little information on the spectral characteristics of the devices being tested, so the results can be considered only as “check points.”
Broadband light sources and optical spectrum analyzer. Loss-measurement instruments form what is called a linear system. That means the device under test (DUT) can be placed anywhere between the source and detector. In the optical spectrum analyzer (OSA) plus broadband source configuration, the DUT is placed directly after the source. The major drawback of this configuration is that it is a single-channel measurement. If the DUT is a 1×16 CWDM or 1×32 coupler, then 16 or 32 separate measurements must be taken to measure all the channels. In addition, if PDL measurements are required, another test station must be added to the test setup, since PDL cannot be easily measured with an OSA. That has many disadvantages, the most serious being the necessity to connect the same DUT twice, then manage an additional batch of test results. The same scenario applies to ORL or directivity. The majority of commercial telecom OSAs are optimized for the C- or C+L-band, which can be a limitation, considering the many new passive components now available on the market.
To assess the efficiency of such a test methodology, consider the test time for an eight-channel CWDM device for IL only. First, eight scans are completed to determine the IL of each channel. Then, eight more scans with a larger resolution bandwidth will have to be performed to increase the dynamic range and eventually be able to measure the isolation (previously called crosstalk) between channels. Up to 10 minutes can be needed to complete the IL characterization of only one device. That has a very important impact on production cost, especially since PDL and ORL measurements will also require a similar test time. And when production ramps up, test time becomes a bottleneck.
Swept wavelength (or swept optical frequency). The most interesting approach, which accommodates a multiple-detector system, is generally known as the swept-wavelength method (although the broadband source plus OSA method is also a swept-wavelength method). It works by sending a monochromatic wavelength-varying optical signal to the DUT and keeping track of fluctuations in transmitted power with respect to wavelength and state of polarization. An optical detector seizes these responses, which help determine IL, PDL, or return loss.
The technique typically uses a tunable laser that sweeps (which continuously changes the wavelength), and a polarization controller is added when PDL measurements are required. Units with multiple detectors are best, since they can measure all channels in one scan, thus considerably speeding up the process for multiport devices. The ultimate in speed would be a unit with a depolarized scanning source and polarization-diverse detector (i.e., a detector for each of four polarizations). For a 32-channel device, that means 128 detectors, 32 optical circuits for polarization splitting, and associated electronics. However, that makes for a very complex and expensive solution not commercially available.
Most of today’s systems control one or many tunable-laser sources (TLSs), since one source usually covers only 100-150 nm or in some cases 200 nm. Data interpretation generally involves stitching of information, which when wide wavelength ranges are involved, will necessarily add to the complexity of the integration and characterization. Testing in the O-band is certainly still a major challenge, since only a few TLSs can cover this range and not many test systems have been qualified outside the C- and L-bands. Again, testing an eight-channel CWDM device may take from a few seconds to minutes for IL only and up to 10 minutes when PDL is measured simultaneously.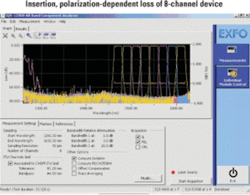
However, the possibility of testing even an eight-channel device over all telecom bands is still very attractive because it can potentially lead to an upgrade: a 16-channel CWDM system that will use the adjacent 1271-1451-nm range. Figure 2 shows an example of an eight-channel device that would not allow for such an upgrade.
As can be seen from the above test-scenario descriptions, thoroughly characterizing passive components on all telecom bands can easily become tedious, since one setup will not do everything-at least not until a truly all-band tester becomes available.
The best compromise between time and complexity is a system with a very wide tunable scanning laser, a polarization controller, and low-polarization-dependent response (PDR) detectors. The main characteristic that makes systems like these so different is testing time. Equipped with an all-band TLS and a high-speed synchronized bank of detectors, such instruments can provide quick, efficient, yet comprehensive results with a single sweep, from 1260 to 1630 nm. For example, testing the IL of an eight-channel CWDM device can be completed in <10 sec; for a 32-channel splitter, IL and PDL measurements can be done in just over 1 minute.
In addition, a polarization-state adjuster (bulk optics) is used to generate the appropriate polarization states required for the Mueller Matrix PDL measurement, while a polarization scrambler is used for the all-states PDL measurement. A single all-band tester can therefore provide multichannel IL, ORL, and PDL measurements over all telecom bands, eliminating the need to switch instruments and speeding up test time.
Such instruments can be used in all passive-component testing, but because of the nearly 400-nm wavelength range they possess, they are particularly suitable for FTTX and CWDM applications. The measurements displayed in Figures 1 and 2 were performed by such an analyzer.
Where do current passive-component test methods rest with standards bodies? Well, from a technical standpoint, the only approach able to measure to the degree expected by the standards bodies is the TLS/detector combination. Particularly with the advent of FTTX and CWDM, organizations like the International Telecommunication Union and International Electrotechnical Commission are working on new standards that have recently been approved or are in the voting stage. The trend is toward testing IL, ORL, and PDL as well as a few other important parameters over wide wavelength ranges (from the O-band to the U-band), depending on the component class.
In fact, the ideal tool is a measurement system that covers loss measurements with respect to polarization over the entire singlemode transmission window (O-, E-, S-, C-, L-, U-bands), from 1260 to 1630 nm, both in transmission and in reflection. That’s where all-band testing comes in.Marie-Hélène Côté is a product manager and François Babin is a research consultant at EXFO Electro-Optical Engineering (Vanier, Quebec, www.exfo.com).