Remote monitoring maintains high-speed performance

The Information Age continues to grow up very quickly. With the integration of data into our communications lines at an ever-increasing rate, the quest for more information traveling ever faster over the fiber lines has reached Crusade proportions. Such a belief is not based upon faith but on statistics, as it is estimated that bandwidth demand will increase by three times per year for the next 25 years. A large part of that growth will occur in the next two years, with demand estimated to grow 10 times within the next 24 months alone!
How will service providers stay afloat in such a sea of bit streams? Many of them are deploying dense wavelength-division multiplexing (DWDM) systems with 80-channel counts in the erbium "C" band. This is only the beginning, as implementation of 100-nm bandwidth optical amplifiers currently under development will increase channel counts to 256. On the heels of this development will be optical-fiber manufacturing techniques for flat optical loss from 1300 to 1650 nm that will allow DWDM to reach more than 800 channels with 0.4-nm spacing. This technique will create data bit rates of greater than 2 Tbits/sec on a single fiber, based on 2.5-Gbit/sec OC-48.
So, it appears technology will help the service providers in building the new "super highway" for the 21st century. The next question is, how will such a heavily trafficked path be maintained? Experienced technicians are going the way of coaxial cable, yet the requirements for testing are moving along as fast as the data that must be analyzed. An added bit of pressure comes from the millions of dollars that can be lost by a downed line, a prospect companies (mostly publicly owned) are not happy about.
Because of DWDM and ever-increasing channel counts, field-test instruments must have near-laboratory quality. Despite this need for exceptional performance, instruments must also be simple to operate because network managers are expected to know more about the optical network with fewer personnel. As a result, test manufacturers are developing instruments with remote capability, as today's instrument is tomorrow's optical-network element installed in the fiber plant.
Presently, network performance monitoring seems to be the biggest testing challenge in maintaining the physical layer. Remote fiber testing can help isolate a fault very quickly during a major interruption but is insufficient to monitor a minor problem, such as a single wavelength of a DWDM system.
Long-term testing is one type of analysis that can be used to reduce the possibility of minor problems. Bit-error-rate checks will identify a fault in the fiber plant before results can be reported by physical measurements; however, the physical measurements and the accumulated tested parameters will show a trend toward possible interruption of service. These physical parameters consist of optical channel spacing, optical power level, optical signal-to-noise, gain, gain tilt (flatness of optical amplifiers as a function of optical frequency), and the deviation from the reference recorded at installation and certification. This performance monitoring must be done without interfering with traffic or affecting the power/loss budget.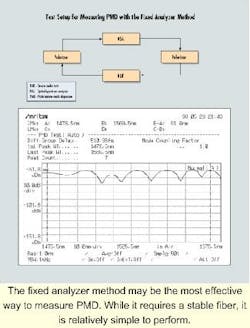
The second type of testing is troubleshooting faults in the fiber plant. To conduct such testing successfully, many of the same parameters listed above must be housed in a portable instrument that can be used at a remote site. Additionally, remote control from a central office is highly desirable because more and more technicians do not have the expertise to identify and repair faults. This places the technical burden on the central office, where the responsibility to maintain the fiber plant is located. As a result, field instruments with "virtual remote" interfaces increase the value of these products greatly.
While telecommunications companies are increasing bandwidth, they are also looking to increase the speed of the individual channels. Some of the manufacturers of transmission equipment are looking to add OC-768 (40 Gbits/sec) to help fill the need for increased transmission. With this increase in transmission rate, dispersion of the signal becomes a major problem, creating serious challenges for performance monitoring.
When a short light pulse is launched into a singlemode optical fiber, there is typically some pulse broadening as it propagates through the fiber. For the most part, this pulse broadening is caused by chromatic dispersion, which occurs when pulses of light contain slightly differing wavelengths. These different wavelengths travel at slightly different speeds (propagation velocity) through a transmission medium (optical fiber). The typical photodetector is sensitive to numerous wavelengths and detects them more or less equally to effectively integrate the power of the differing wavelengths into a single electrical pulse. Since the differing wavelengths have different propagation velocities and arrive at the photodetector at slightly different times, the observed effect is a broadening of the electrical pulse.
Another phenomenon that contributes to pulse broadening is polarization-mode dispersion (PMD). Each quantum unit of light, called a photon, has a unique polarization defined by the orientation of the "E" field. Due to the nature of real-world optical fiber, there are minor imperfections, such as slightly elliptical cores, bends, twists, and other physical anomalies, that cause light of one polarization mode to be transmitted at a different velocity as compared to light of another polarization mode. The result is that a single-wavelength pulsed source with randomly variable polarization modes may experience pulse broadening.
The degree of pulse broadening due to PMD is considerably less than that resulting from chromatic dispersion but it is significant when considering multigigabit transmission. The problem may be generalized by saying that total dispersion should not exceed 1/10 of a bit period. Thus, for a system operating at 10 Gbits/sec (OC-192), the combined chromatic and PMD (the differential group delay, or DGD) should not exceed approximately 10 psec. Of course, for OC-768 transmission the DGD should not exceed approximately 2.5 psec.
While chromatic dispersion is a constant for a specific fiber, PMD can exhibit changes due to any alterations in the quiescent state of the fiber. Even small changes in a fiber can cause relatively large changes in PMD. Aerial fiber installations will be limited to the lower transmission rates, as the fiber blowing in the wind and the constant changes in temperature will cause constant changes in the PMD of the fibers.
It can be seen that measuring PMD becomes important when multigigabit transmission systems are under consideration. A high DGD will result in a higher bit-error rate. This, of course, is unacceptable.
There are a number of methods available for measuring PMD and thus characterizing optical fiber and devices. The most straightforward method simply measures the pulse transit time for different polarizations of light and then calculates the DGD. This calculation is accomplished by launching a pulse into the device under test (DUT) and measuring the propagation time. The state of polarization is then changed, and a new propagation time is measured.
This technique is called "pulse delay," and it will yield reasonably accurate results. The disadvantages of this method are that the polarizers must be adjusted to determine the principal input polarization state and that it measures the whole DGD and not just PMD. Once done, however, the measurements are accurate and meaningful.
The second method, the "interferometric" method, uses an interferometer to generate a fringe pattern. DGD may be inferred or calculated based on the number of fringes generated. This method has the advantage of allowing the operator to measure small femtosecond ranges. It also has a high dynamic range. The disadvantage is the unsuitability of this method for field measurements. It is complex and requires a stable environment with little or no mechanical vibrations.
The "Poincare sphere" method measures PMD in the frequency domain and measures the state of polarization of the fiber or DUT as a function of frequency. This technique can be used to measure DGD for specific frequencies or wavelengths. It has the advantage of being accurate for both large and small values of PMD, with the accuracy being limited by the stability of the fiber under test.
The "Jones matrix" method is similar to the Poincare sphere method, except that the Jones matrix method measures a predetermined set of polarization states and then calculates the actual state of polarization (SOP). Both of these methods have the disadvantage of being cumbersome and complex and are thus unsuitable for any field measurements.
Possibly the best method for performance monitoring is the "fixed analyzer" method, which uses two polarizers-one before and the other after the DUT (see Figure). The first polarizer sets the SOP of the light launched into the DUT, while the second polarizer is adjusted to maximize the amplitude versus wavelength changes. The signal is then viewed on an optical spectrum analyzer (OSA). The amplitude variations yield an amplitude versus frequency/wavelength plot that allows PMD to be calculated.
Generally, taking a peak count for a specific span of wavelengths allows the operator (or algorithm) to calculate PMD. This method has a strong advantage in that the apparatus is simple and the data analysis is easily accomplished with simple algorithms. Its disadvantage is that it requires a stable fiber while the measurement is being taken. In other words, it may not be suitable for measuring instantaneous PMD on aerial cable, as physical changes (wind blowing, change of temperature, etc.) will cause the display to vary. In general, though, it is well-suited to measuring underground installations or devices mounted in a laboratory.
Another challenge facing those involved in fiber transmission is smaller channel spacing, such as 0.4, 0.8, and 1.6 nm. An OSA is useful during installation and certification because it will help eliminate potential problems with channel spacing. The most effective OSAs for these applications will have 1450- to 1650-nm wavelength measurement ranges and a dynamic range greater than 70 dB. They also may have a defraction grating with a double pass monochrometer, which meets the demands of DWDM systems with channel spacing down to 0.4 nm.
Application firmware permits OSAs to measure all the physical parameters, including channel spacing, optical power level, gain flatness, optical signal-to-noise ratio, and others to analyze the DWDM spectrum. Preset tests allow these parameters to be measured and saved by a technician and then reviewed by an engineer back at a central office to maintain the health of the fiber plant.
An OSA with a built-in superluminescent diode reference light source is important because it can measure other parameters of the fiber plant such as reflectivity, directivity, and isolation. Such analysis in one instrument is invaluable in light of the fact that many service providers expect to have the ability to monitor more than 120 channels of DWDM, with more than 250 channels deployed in the near future. To protect service providers' investment, test manufacturers have made firmware upgrades available.
OSAs can also accurately measure fiber components. Erbium-doped fiber amplifiers generate a high level of noise called amplified simultaneous emission (ASE), which creates a challenge of measuring the true gain of an optical amplifier in the presence of self-generated noise. To achieve necessary measurement performance, an external modulator pulse technique is integrated with the OSA. The purpose of this light modulator is to optically switch at a rate faster than the metastable state optical amplifier can react, yet slow enough to allow the optical measurement. This technique stabilizes noise and is better-suited for DWDM testing than the traditional curve fitting technique.
With the pulse-measuring technique, ASE levels at the signal wavelength can be measured directly because of excellent modulator on/off extinction ratio. This technique eliminates discrepancies between the fitted curve and actual noise, a common problem when using curve fitting. Because the ASE level is accurately measured, polarization dependence and input loss are optimized and reliability is ensured. As a result, the small difference between wavelengths of multiple signals found in DWDM systems can be measured. These measurements are channel-count independent.
Predictions of increased data usage over fiber lines have obviously come to fruition. Many telecommunications companies have taken the appropriate steps to accommodate more bandwidth and increase data transmission, along with voice and video. For this growth to continue, performance testing is going to have to keep pace. To do that, test instruments must be equipped to perform complex tests quickly from a remote location by technicians with relatively little experience. The evolution of such instruments has begun and will continue as long as the demand for increased fiber performance exists. u
Michael P. McArthur is a sales support engineer for Anritsu Co. (Richardson, TX).