Critical system parameters for network installation

While requirements may differ among applications, measuring link performance is universally important.
André Girard, et al.
EXFO Electro-Optical Engineering Inc.
WDM technology has the potential to dramatically increase the capacity of existing networks, reduce the cost of network upgrades by increasing the bandwidth of existing links, and offer new options for all-optical-network design. These goals can be met only by confirming the correct operation of all the network components through extensive testing during installation and by checking ongoing performance through appropriate maintenance procedures.
Critical system parameters are different for individual components. In addition, the effects induced by the different components combine in ways difficult to foresee. In certain cases they are added, in other instances they are increased, and sometimes they are removed. Furthermore, external environmental conditions, physical and optical distance, and connectors and patch cords can create unforeseen problems on a single component.
The overall performance of a WDM network system is based on the following major factors:
- Laser transmitter output power level-this level should be as high and as stable as possible to increase the transmission span length but not to the detriment of nonlinear effects.
- Number of channels-the number of channels times the modulation rate defines the total system bandwidth; for example: 40 wavelengths at 2.5 Gbits/sec (STM-16 or OC-48) gives a total system bandwidth of 100 Gbits/sec.
- The channel spacing capability in gigahertz-ITU-T has defined a standard channel spacing of 100 GHz-about 0.8 nm-in the ITU grid; 50 GHz is also proposed in the grid-about 0.4 nm-and eventually lower values will be added.
- Laser transmitter modulation rate in gigabits/sec-long-haul communications are currently at STM-16 or OC-48 (2.5 Gbits/sec) and STM-64 or OC-192 (10 Gbits/sec) rates; metropolitan communications are usually at much lower rates.
- Erbium-doped fiber amplifier (EDFA) gain, both amplitude and spectral width-small signal gains of 30 to 40 dB are typical, while spectral widths of 40 nm are typical in non-extended-range EDFA.
- Receiver gain (as high and as stable as possible).
- Fiber type and specifications (critical for data rate, dispersion, and maximum channel possibility).
Even though it is possible to characterize system performance with the previous parameters, many more considerations have to be taken into account to carry out a complete study of the system performance.
Suppose the installer has a tentative design for a fiber-optic data link of the type illustrated in Figure 1. How does the installer analyze it to see if it will meet requirements?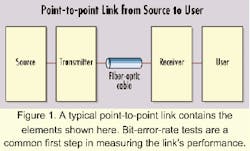
Performance requirements are usually characterized in terms of an acceptable bit-error rate (BER), whose value generally depends on a specific source-to-user application. It might be as high as 10-3 for applications such as digitized voice or as low as 10-12 for scientific data. The tendency is toward ever-lower BER requirements.
Will the tentative link design provide the required BER? To answer this question, we must look at the receiver sensitivity. This specification indicates how much optical power the link must receive if it is to deliver the required BER.
To determine whether the tentative link design can deliver this power, the installer must analyze it-step through the components of the link to determine just how much power will reach the receiver. That is done with a fiber-optic data-link power budget.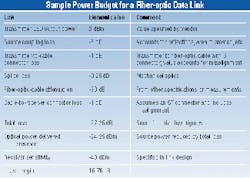
A power budget for a particular example is presented in Table 1. Clearly, the optical power at the receiver is greater than that required to achieve the necessary BER. The loss margin entry is significant since it specifies the amount by which the received optical power exceeds that required. In this example, it is 15.75 dB. Good design practice requires that it be at least 10 dB. Why? Because no matter how carefully the power budget is estimated, some entries are always forgotten and some are too optimistic. In other cases, vendor specifications turn out to be inaccurate and an allowance must always be made for future maintenance.
The loss test is the principal evaluator of the performance of a system or link. Individual losses can be measured or interpreted according to a variety of procedures and criteria, but the primary result of loss testing is to provide an overall performance figure for the link in question.
Losses depend on components and are a function of optical signal distance. They are to be expected in each component or subsystem, even with top-quality products. Losses are inevitable in connectors, multiplexers, demultiplexers, and the fiber itself.
When light is injected into a fiber-optic component, some of the energy is reflected. The optical return loss is directly associated with bad connectors or splices and defective components. We can also attribute the loss to the reflections that occur at discrete interfaces as a result of air gaps, misalignment, and mismatched refractive indices. The result of such losses is that the signal will lose power, the integrity of the data will be damaged by multipath interference, and the stability of the source will tend to become lower.
Loss fluctuates from one channel to another, and that is the main reason tests must be performed over the entire spectral range. The high-performance lasers used in DWDM systems are very sensitive to reflected light, which can degrade the stability of the laser and signal-to-noise ratio or even damage the source. Reflections can appear in the EDFAs and cause major increases in the noise figure. All these problems must be measured before and after the decisive signal is put to the network.
The terms "optical return loss"-often abbreviated to return loss-and "reflectance" are both commonly used to quantify reflected power. The two are often confused. Optical return loss (ORL) is generally used to describe the total reflection in a fiber-optic network system or subsystem, measured at a specific location:
ORL (dB) = 10 log 10 (incident power/reflected power).
ORL, measured in decibels, is always positive (the incident power is always greater than the reflected power). At a system interface, for example, if there is 1 mW of incident power and 1 µW of reflected power, the return loss is 30 dB. A higher value means less reflected power and, thus, better performance.
Reflectance is usually used to describe a reflection at a single interface or other site at the component level, for example, at a connector. Although ORL and reflectance are defined differently, each represents a ratio between the incident and reflected power. As both are commonly quoted in decibels, conversion from one to the other is simply a matter of changing the sign:
Reflectance (dB) = 10 log 10
(reflected power from specific interface/incident power).
Reflectance, also measured in decibels, is always negative (reflected power is always smaller than incident power). At a connector, for example, if there is 1 mW of incident power and 1 µW of reflected power, the reflectance is -30 dB. A greater negative value means less reflected power and, thus, better performance.
Although the BER is the best parameter to characterize the performance of a link, it is determined principally by the optical signal-to-noise ratio (OSNR). Therefore, the OSNR is invariably determined whenever a DWDM system is installed. It characterizes the "head room" between the peak power and noise floor at the receiver for each channel. It is an indication of the readability of the received signal-a parameter of increasing interest as the limits for long-distance applications are pushed farther.
OSNR is graphically represented as the ratio between signal and noise power as a function of wavelength (see Figure 2). The value, measured at the output of the first multiplexer, should be greater than 40 dB for all channels. It will be greatly affected by any optical amplifiers in the link and drop to about 20 dB at the end of the link, depending on the link length, number of cascaded EDFAs, and bit rate. An individual EDFA should not degrade the OSNR by more than 3 to 7 dB.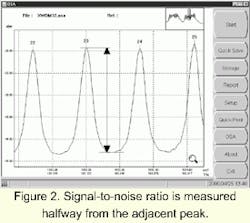
Optical noise, which has taken on new importance since the introduction of optical amplifiers in transmission systems, is due mainly to amplified spontaneous emission (ASE) in the EDFAs. Although the manufacturer has almost certainly tested the EDFAs individually, it is important to check their performance onsite, with all optical channels in operation and all cascaded amplifiers present, to confirm that overall performance expectations are being met. Gain variation merits special attention in multi-amplifier systems, since it will directly affect system power flatness. ASE noise figures can be particularly significant in some configurations, since this phenomenon degrades the signal-to-noise ratio in all optical channels.
System gain will vary over time because of temperature changes, local stress, component degradation, and network modifications.
The OSNR must be determined for each populated channel in a WDM system. It is defined as:
OSNR = worst-case value of
(10 Log [P1/N1] + 10 Log [Bm/Br]) dB
where PI is the optical signal power in the ith channel and Br is the reference optical bandwidth. Bm and Br may be either frequency or wavelength; Br is typically 0.1 nm. NI is the interpolated value of noise power measured in the noise-equivalent bandwidth, Bm, for the ith channel:
N1=N[λi - ΔΛ] + N[Λi + Δλ]) / 2
where Δλ is the interpolation offset less than or equal to one-half the channel spacing.
Deficiencies in ONSR must be dealt with by configuration changes, generally by adding optical amplification at appropriate points in the link. ONSR is obviously a particularly significant parameter to be determined at links between connected operators as a measure of the quality of the signal supplied.
Optical signals are modified many times in passing from a source to an ultimate receiver in a network. In an optical network using EDFAs, the gain for individual channels depends on the channel population at that particular point, so means must be available to check that the signal-to-noise ratio of every channel remains adequate at the receiver; aggregate measurements are not sufficient. And, of course, means must be available to determine the cause of any discrepancies.
Although the overall go/no-go criterion may be based on total power and the power in each channel, tracing the cause of weak channels may well require an ability to check gain flatness at individual amplifiers as well as investigate a variety of polarization and nonlinear effects. All require accurate spectral information about the signal.
The central wavelength of each channel in the signal is probably the most important characteristic, given that its accuracy ultimately determines the ability of the source to communicate with the receiver.
The precise value of the central wavelength of each channel must be measured when the network is first installed to ensure that design specifications are met. These values must also be monitored during maintenance programs to detect unacceptable drift. The accuracy of central-wavelength measurement increases in importance as channel bandwidths and spacings decrease.
In a switched DWDM optical network, a comprehensive, carefully planned policy is needed to govern wavelength usage, eliminate conflicts in wavelength assignment, and minimize possible interaction between wavelengths. The international standard for channel spacing now defines integer multiples of 100 GHz (about 0.8 nm). This spacing was chosen because it offers a good compromise between high capacity and tight component specifications, but it still represents a demanding tolerance for all the equipment in the transmission path. Spacing of 50 GHz is commonly used for new installations.
Since a 100-GHz channel separation implies very narrow channel bandwidths, spectral drifts in the distributed-feedback (DFB) lasers used as transmission sources can have devastating effects on signal levels at the receiver end. Therefore, source stability and spectral purity are of paramount importance. Side lobes are also of particular concern, since they can add noise to adjacent DWDM channels. Although older, unstabilized lasers used in SONET networks cannot meet these requirements, existing transmission equipment can be upgraded for DWDM use by replacing these sources with spectrally stabilized DFB models. In some cases, installed equipment can be converted to DWDM by directly inserting OC-48 laser signals into the stabilized, modulated DFB.
Real optical sources are not absolutely stable because their output power and central wavelengths can be expected to drift. Figure 3 shows a typical result of monitoring a source over a 12-hour period. Drift is caused by such factors as temperature changes, backreflection, and laser chirp phenomena.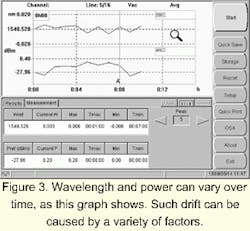
The primary concern with drift is that the signal must remain within the acceptable channel limits at all times, under all operating conditions. Excessive drift may cause the loss of the signal in the affected channel. The drifting source may even spill over into an adjacent channel and interfere disastrously with the information transfer there. Drift must be measured and controlled to avoid loss of data.
Crosstalk-the unwanted contribution of energy from one channel to other channels-is another effect whose magnitude is difficult to accurately predict from pre-installation data. It must be observed in real life, with real (or at least simulated) signals present.
Crosstalk calculations involve a detailed examination of the shape of the passbands of two adjacent channels to check that the amount of signal leaking from one channel to the other is negligible. Normally, a minimum of 25 dB is required between channels, but 13 dB might suffice for a submarine link, and 17 dB values have been tolerated in very-long-haul applications.
Calculations based on pre-installation measurements cannot give accurate values; crosstalk must be checked when all the components of a network are assembled. Crosstalk must also be checked periodically during maintenance to assure the quality of signal transmission.
Nonlinear effects that are not apparent when fibers are tested can become important only once a network is put into operation. The changes brought on by interconnecting equipment and installing it in the field can induce any of several such effects. Care should be taken-especially during installation as well as at appropriate maintenance intervals-to check for nonlinear perturbations.
Four-wave mixing requires special attention because of the seriousness of its consequences on a network. When two optical signals interact in this way, energy extracted from them can turn up at wavelengths in use by other channels, thus seriously disturbing network operation. Although the effect is similar to crosstalk, degradation of performance is not limited to the two conflicting channels. The size of the effect depends on the relative polarizations of the two interacting signals as well as their magnitude and channel spacing.
Four-wave mixing can be reduced by increasing channel spacing or by using unequal channel spacing; either is difficult to achieve after a network design is finalized. For networks not already in place, using a fiber with an appropriate amount of chromatic dispersion can reduce four-wave mixing. Since four-wave mixing can at least potentially be counterbalanced, it is important to know its exact magnitude.
In the long fiber spans typical of real networks, polarization-mode dispersion (PMD) will arise from a number of causes such as inherent heterogeneities in the fiber, mechanical perturbations from bends and stress-producing supports, and a variety of temperature effects. Because of the quasi-random nature of all these effects, the most useful characterization of the phenomenon is the expected value of the group-delay variation (
The character of PMD-and even the units most useful to express it-depends on the degree of mode coupling in the optical fiber. In practical terms, the transition between the two states occurs at distances equaling the coupling length, Ic, of the fiber-that is, the length of fiber at which energy transfer between the polarization states becomes appreciable. Values of Ic seldom exceed a kilometer, and values below and around 300 m are common, so most real-life networks operate under conditions of strong random-mode coupling, in which PMD is expressed as an expected time delay per square root of the unit length (e.g., psec/Ãkm).
PMD is of particular significance in old cables laid in the late 1980s, when manufacturing techniques and processes were not as advanced as they are now and the phenomenon and its causes were not well recognized or understood. Now fiber manufacturers are aware of the importance of maintaining near-ideal core geometry throughout the length of fiber, and cable manufacturers take care to avoid placing undue stress on the fiber when winding cable. Finally, carriers and installers now appreciate the effect that the operating environment can have on PMD. But these kilometers of cable laid in the late 1980s-with different types and ages intermixed-create complexity and difficulty for network operators who are planning capacity upgrades to OC-192/STM-64.
When judiciously selected and properly controlled, chromatic dispersion can minimize certain nonlinear effects in optical fiber or even take advantage of them (as in dispersion-aided or managed fibers). In some situations, not only can the total dispersion be controlled, but various nonlinear effects also can be minimized, even within and along a single fiber.
Field measurement of chromatic dispersion will be more and more important in the future, however, as existing networks and infrastructures are investigated for their upgrade possibilities.
A number of other phenomena are important to the characterization and performance of the components of a fiber-optic link:
- OSNR degradation (dB).
- Optical-crosstalk-related parameters, including in-band crosstalk ratio (dB) and out-of-band crosstalk ratio (dB).
- Frequency-response-related parameters such as ripple (dB), insertion loss (dB), and channel width (GHz).
- Polarization-related-parameters, such as differential group delay (psec), polarization-dependent loss (dB), and end-to-end PDL measurement (dB).
Measuring these optical and electronic parameters is vital to ensure each channel of a WDM network is operating at the specified wavelength and that all network elements are spectrally aligned according to the design specifications. Once all critical components are installed, they must be tested again to ensure that they still conform to the system provider's requirements. They will have to be tested before the system is put into operation (commissioning) and on a regular basis after that (maintenance).
André Girard is a senior member of the technical staff at EXFO Electro-Optical Engineering Inc. (Vanier, Quebec). This article was adapted from "Guide to WDM Technology and Testing," published by EXFO Electro-Optical Engineering Inc.; phone: (418) 683-0211.