Can a network's fiber go the distance?
Calculate the optical power budget to see if the network can cover all of its losses.
Cheri Podzimek
Transition Networks
Distance is one of the key benefits of fiber. But the question of "how far can it go?" continues to come up. Distance is largely determined by the network's optical power budget, measured in decibels, which indicates whether the light available is enough to cover all the losses. If there is enough light, then the connection will work; if there is not, then it won't work. Fortunately, optical power budgets are not hard to calculate; simple addition, subtraction, and multiplication are all that's required.
Why is there an increased interest in knowing the maximum distance to transmit over a given fiber link? Dark fiber is the reason. Over the past few years, virtually every company with right-of-way has been burying singlemode-fiber cable-some in anticipation of future bandwidth requirements, others with the immediate need for bandwidth. Telecommunications companies, cable-TV carriers, and even local municipalities have been installing fiber at a break-neck pace. In many cases, these organizations are using less than 10% of the installed fiber, with the remaining 90%-plus sitting idle or "dark."
Carriers building metropolitan area networks (MANs) have a great interest in this excess dark fiber. MAN operators face limited options for network connections between various buildings. In most cases, the MAN operator is forced to use services from local carriers, which can be expensive and require that the user operate at a lower bandwidth in a non-native protocol.
Carriers connecting buildings across a MAN are considering the use of dark fiber as one potential option. In light of that, these providers need to understand and calculate the optical power budget to ensure that their network connections operate trouble-free.
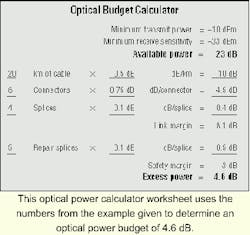
The first step in calculating the optical power budget is to determine how much light is available for the network's electronic devices. To accomplish this, two numbers are needed from the equipment manufacturers: the minimum transmit power and minimum receive sensitivity, both of which are expressed in decibels with reference to one milliwatt, or dBm.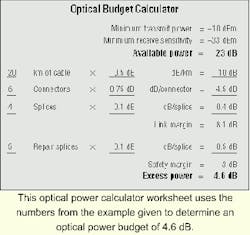
The minimum transmit power represents the worst case for a device; it is guaranteed to provide at least that much power. Some vendors will list an "average transmit power." By its very definition, this number is meaningless. If a number is an average, that means sometimes the number is greater, sometimes smaller. If a calculation is done using an average number, what happens if the product performs below average? It won't work.
The second piece of information, the minimum receive sensitivity, represents the minimum amount of light required by the receiver to operate correctly. Again, the actual minimum should be used, not an average of minimum figures.
With minimum transmit power and minimum receive sensitivity data, you can now calculate the available light. Simply subtract the minimum receive sensitivity from the minimum transmit power:
Available light = minimum transmit power - minimum receive sensitivity.
Note that the minimum receive sensitivity is usually a negative number such as -33 dBm. Subtracting two negative numbers is the same as adding their absolute values. For example, if a device has a minimum transmit power of -10 dBm and a minimum receive sensitivity of -33 dBm, then the available power would be -10 minus -33 = 23 dB.
One other note of clarification, when connecting devices from different vendors or different models of products from the same vendor, the available power calculation is computed in both directions and the smaller of the two is used for the rest of the calculations. For example, assume you are connecting two devices labeled device 1 and device 2. Device 1 has a minimum transmit power of -3 dBm and a minimum receive sensitivity of -32 dBm. Device 2 has a minimum transmit power of -1 dBm and a receive sensitivity of -31 dBm (see Table 1).The available power going from device 1 to device 2 is calculated by subtracting -3 dBm from -31 dBm, which equals a link budget of 28 dB. The available power going from device 2 to device 1 is calculated by subtracting -1 dBm from -32 dBm, which equals 29 dB. There is less light available in the device 1 to device 2 direction, so it is best to use 28 dB for your calculations. Logically, if the half of the link with the lowest budget works, then the other half will also work.
The next step is to subtract all of the losses such as cable attenuation, connector loss, and splice loss from the available power. Cable attenuation, often the most significant, is determined by getting the exact number off of the cable or using the manufacturer's worst-case number for the type of fiber planned for installation. This number will range from 0.22 to 0.5 dB/km. Multiply this figure by the number of kilometers in the installation, for ex ample, 0.4 dB/km x 40 km = 16 dB. A fiber with 0.4 dB/km of loss, will loose 16 dB over a 40-km distance.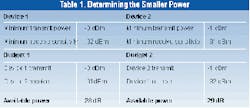
Remember that fiber does not come in 40-km spools; therefore, a 40-km installation will have several splices. Each splice will typically introduce 0.1 dB of additional loss. Fiber in stallers should be able to provide a guaranteed worst-case number. Multiply this number by the number of splices, one splice per 6 km is typical.
Next come connectors. A typical long-haul installation will have six connectors in the installation. The first connects the fiber to electronics. This connector is usually on indoor plenum-rated fiber. This fiber connects the equipment room to the building entrance for the outdoor (buried or aerial) fiber. There is another connector on this end of the indoor cable and one on the outdoor cable. This setup is repeated at the other end of the network, making a total of six connectors on the entire installation. Individual networks can vary, however, and the exact number of connectors used in each network must be determined. The connector loss is provided by the connector manufacturer and the installer. Multiply the number of connectors by the loss for each connector to get the total connector loss-a 0.75-dB loss per connector is typical.
Each of these losses-cable attenuation, connector loss, and splice loss-are then subtracted from the available power. If this number is negative, there is no need to continue because there isn't enough power to drive the network. If this number is positive, there are two more factors to consider before pronouncing the network fit.
What happens if the fiber gets cut and has to be spliced back together? Because repairs are likely, an estimate of the number of repairs over the life of the fiber needs to be made. Five repairs is commonly used in optical power budget calculations. These repairs will add splice loss, so multiply the number of anticipated splices by the loss of each splice (same number used above), and subtract this from the remaining power. The power figure should still be positive.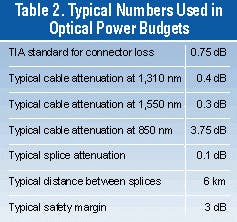
Finally, the optical power budget needs to account for temperature extremes as well as any other unforeseen factors. This number or "safety value" is different for every organization, depending on how much risk the company wants to assume and the environment the network must operate in-a common safety value is around 3 dB. To guarantee error-free operation, a value of no less then 1.7 dB should be used. The safety value is subtracted from the remaining power. If the number is still positive, rest assured that the fiber network will deliver the required performance over the life of the installation.
Table 2 contains typical numbers used in optical link budget calculations. If at all possible, real numbers from the network in question should be used. The sample worksheet can also help in these calculations.
Careful calculation of the optical power budget allowed a competitive local-exchange carrier (CLEC) to reliably provide metropolitan area access to its customers. In March 1999, FirstCom Peru began offering multinational, national, and local businesses a broad array of high-quality data, video, and voice communications services, including LAN interconnection, frame relay, remote-terminal access, and dedicated channels for access to the Internet, on a private-line basis.
Rather than purchasing fiber-based switches, FirstCom Peru sought a more cost-effective solution utilizing copper-based switches from Cisco Systems and external media converters. The CLEC adopted a 16-slot high-density chassis from Transition Networks capable of accepting converter modules from numerous networking protocols, including unshielded-twisted-pair-to-fiber conversions for Ethernet, Fast Ethernet, ATM, FDDI, and Token Ring as well as singlemode-to-multimode-fiber conversions for those protocols and for Gigabit Ethernet and OC-12 (622-Mbit/sec) environments. The conversion center provided a central physical connectivity point for large LANs.
FirstCom Peru now has approximately 25,000 km of fiber optics installed in the capital city of Lima, connecting over 140 buildings. The fiber network uses more than 1,500 media converters, includes nearly 100 conversion centers, and is managed with the simple network management protocol.
Dark fiber is available today most commonly from CLECs or incumbent local-exchange carriers (ILECs) through a lease arrangement. Under the typical agreement, access is provided by the CLEC/ILEC, and the user supplies the equipment to "light" the fiber. The advantages to leasing dark fiber are cost (less expensive than a T1 and all the necessary devices); security, since only the user has access to the fiber; and the ability to run native protocols, most commonly 100-Mbit/sec Fast Ethernet, in effectively what is a long-haul backbone connection. The only limitation is that it's confined to about 80 km in distance across a given link. However, distance improvements are being made on an ongoing basis.
Cheri Podzimek is vice president of marketing at Transition Networks (Minneapolis).