Sandvine Eyes Peak Period Traffic
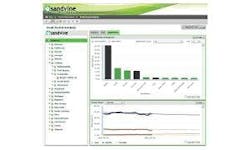
Sandvine (TSX:SVC;AIM:SAND) announced the launch of its Peak Period Analysis Dashboard, the latest in its Network Analytics library. The new dashboard is designed to provide statistics and predictions using actual network data captured within the periods of peak bandwidth usage to enable more accurate capacity planning.The Peak Period Analysis Dashboard is one of the dashboards included in Sandvine's Network Analytics. Sandvine's interactive dashboards are designed to provide aggregate, network-wide performance indicators that can be granularly measured and categorized by location, device and subscriber tier, and allow trending across peaks, by time and actual peak usage.Sandvine will be showcasing the new dashboard at the CableLabs Summer Conference, Aug. 5-7, in Keystone, CO.